
❋
Exploring Educational Inequities
Understanding how funding disparities influence student outcomes in Tacoma Public Schools.
Project Snapshot
Duration
10 Weeks
Role
UX Researcher & Data Analyst
Contributions
Research Planning • Statistical Analysis • Data Visualization • Qualitative Interviews
Tools
Python • Plotly • Pandas • Excel
Introduction
Why This Project?
Growing up on the south/east side of Tacoma, I experienced firsthand how educational opportunities varied across neighborhoods. Differences in facilities, extracurricular activities, and academic resources sparked my curiosity about whether these disparities extended beyond personal experience.
For this project, I investigated how differences in educational funding relate to student outcomes across Tacoma Public Schools by combining quantitative data analysis with qualitative research. My goal was not only to identify patterns, but also to better understand how funding inequities may shape students' educational experiences and outcomes.
How do funding disparities across Tacoma Public Schools influence educational opportunities and student outcomes?
To answer this, I explored three areas:
How funding differs across Tacoma high schools
Whether funding correlates with academic outcomes
Which disparities students experience most directly
These questions were adapted from the original research plan.
Research Question
-
Collected education equity data from Tacoma Open Data.
Gathered student outcome metrics from Tacoma Public Schools.
Conducted one semi-structured interview.
Reviewed community discussions on Reddit.
-
Cleaned and merged datasets using Python and Pandas.
Performed t-tests to compare funding groups.
Explored correlations between equity and student outcomes.
Created visualizations with Plotly.
-
Analyzed interview transcripts.
Identified recurring themes.
Compared qualitative insights with quantitative findings.
-
Combined statistical evidence with qualitative findings.
Identified three key insights about educational inequity.
By combining statistical analysis with qualitative research, I identified three overarching insights about educational equity in Tacoma Public Schools.
01: Education equity disparities are measurable across Tacoma Public Schools
Using Tacoma’s Education Equity Index as a proxy for differences in resources and funding. I found measurable disparities between the school groups I analyzed.
A t-test confirmed that the differences were statistically significant (t = 4.42, p = 0.0034), suggesting that the disparities observed across schools were unlikely to be explained by random variation alone.
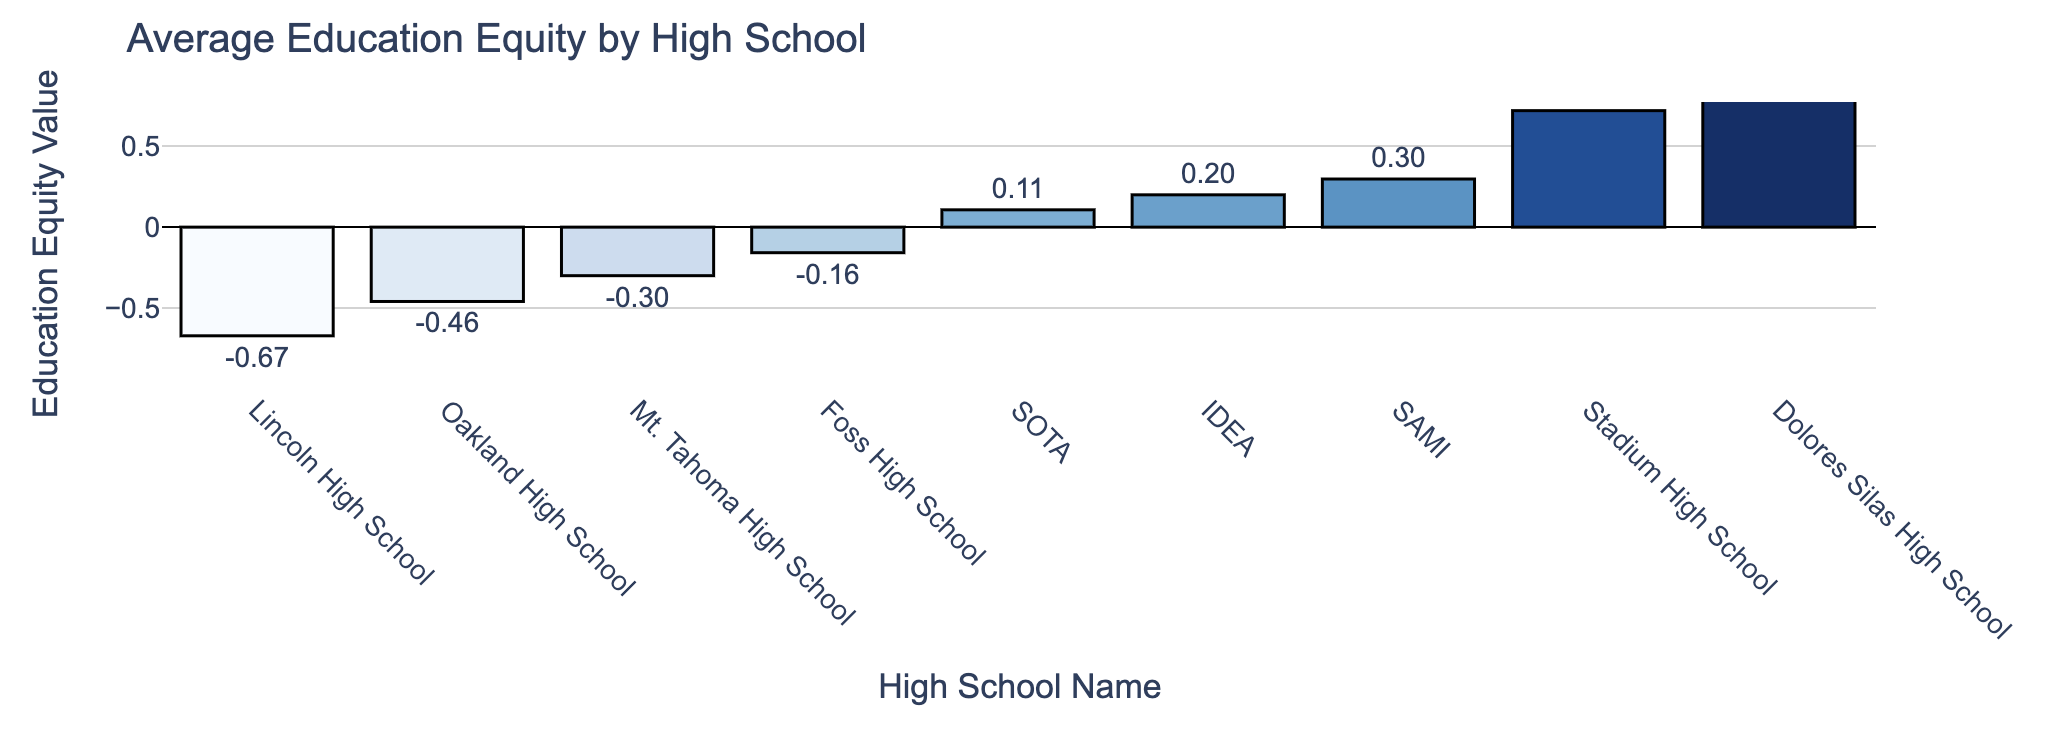
Takeaway: Students across Tacoma are not experiencing the same educational conditions and access to resources.
02: Higher education equity was associated with stronger student outcomes
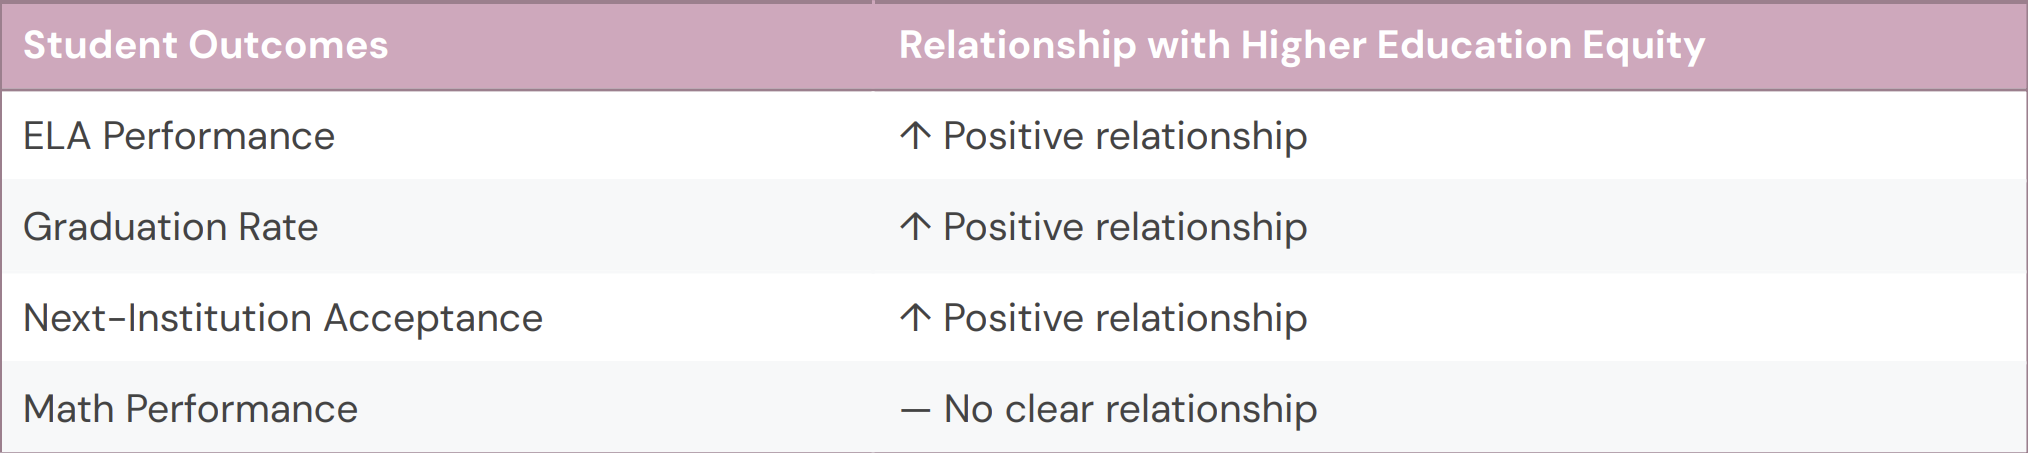
Schools with higher education-equity values tended to show fewer students below ELA standards, higher graduation rates, and higher rates of acceptance to a next institution.
However, math performance did not show the same clear relationship.
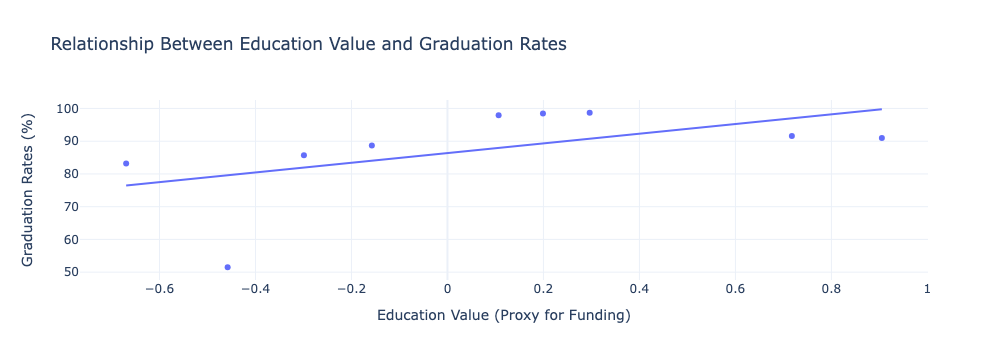
Graduation rates as a representative example:
Takeaway: Resources and educational conditions may be associated with important student outcomes, but the relationship is complex and does not affect every academic measure equally.
03: Educational inequity extends beyond academic outcomes
Quantitative data revealed differences in student outcomes, while qualitative research showed how these disparities shaped students' everyday educational experiences.
A former Tacoma Public Schools student who attended Lincoln, SOTA, and Stadium described noticeable differences in facilities, equipment, extracurricular opportunities, and access to specialized resources across schools.
“Lincoln had old and rundown facilities... Stadium had better art equipment, a theater, and more instruments.”
— Anonymous Participant, Former TPS Student
Takeaway: Educational inequity isn't only reflected in academic outcomes—it can also shape the environments, resources, and opportunities students experience every day.
Limitations
01: Funding was measured through a proxy.
Exact school-level funding data wasn't available, so I used Tacoma's Education Equity Index as a proxy for educational resources. As a result, my findings show associations with education equity rather than direct causal effects of funding.
02: The qualitative sample was limited.
Due to time constraints, I conducted one in-depth interview. While it added context to the quantitative findings, one participant cannot represent all TPS student experiences.
03: Student outcomes are influenced by more than resources.
Factors such as teaching quality, school culture, family circumstances, and community support were outside the scope of this study and may also contribute to differences in student outcomes.
Reflection
This project challenged me to look beyond what the numbers initially appeared to say. Statistical analysis helped me identify patterns, but qualitative research gave those patterns context and exposed experiences that couldn't be captured through a dataset alone.
Most importantly, I learned to treat data as evidence rather than an answer. Combining quantitative and qualitative methods helped me build a more nuanced understanding of educational inequity while recognizing the limits of the conclusions I could draw.
If I continued this research…
I would expand the study by interviewing students, teachers, and administrators across multiple Tacoma high schools and incorporate direct school-level funding and resource-allocation data. I would also investigate additional variables that may help explain why some outcomes, particularly math performance, did not follow the same patterns found elsewhere in the analysis.